What the Looming Debt Ceiling Deadline Means for Investors

The debt ceiling debate has been front and center lately, and will no doubt be a major news story in the coming weeks. We thought we’d share this article and charts from our partners at Clearnomics discussing this issue and how it may impact markets.
The federal debt limit is once again in the news as the country rapidly approaches a critical deadline on June 1. Investors are understandably nervous about Washington failing to reach an agreement, a possibility that both sides agree would be a self-inflicted catastrophe. While it’s unclear how this will play out in the coming weeks, the fortunate news is that financial markets are mostly taking these events in stride. How can investors maintain the right perspective around political and fiscal uncertainty?
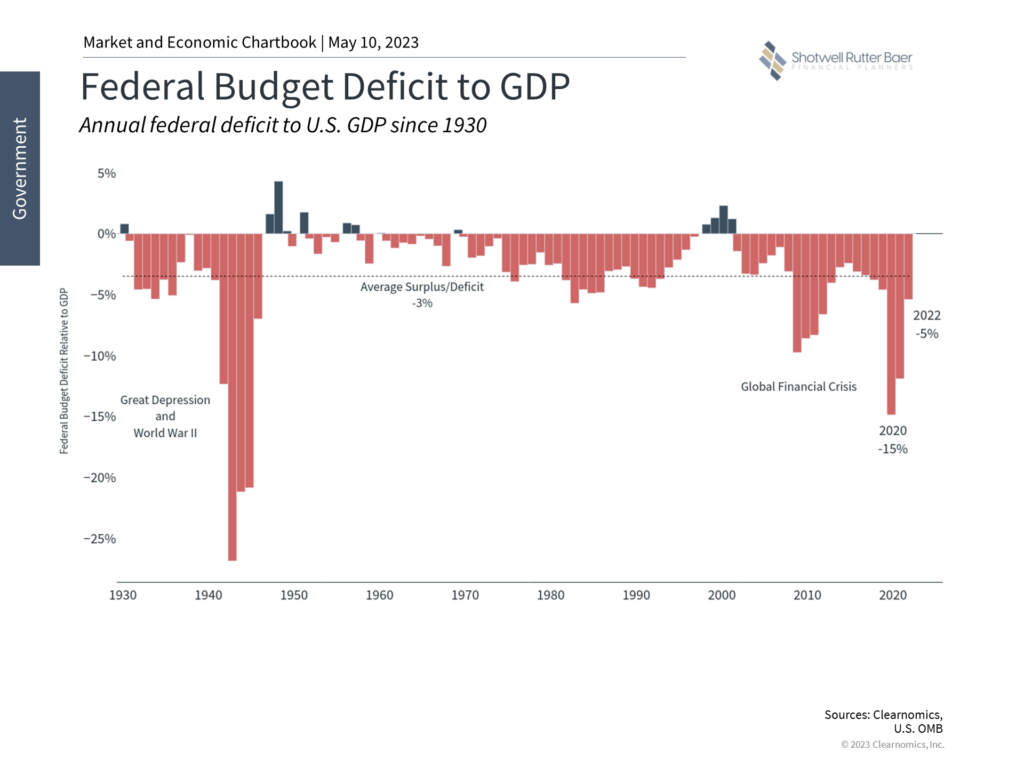
Federal borrowing reached the debt limit this past January
First, it’s important to understand what the debt limit is and is not. In simple terms, the federal government borrows money to pay its bills by issuing Treasury securities. This is necessary because the federal government often operates with a deficit whereby spending (on defense, Social Security, emergency pandemic stimulus, and more) exceeds government revenues (which consist primarily of tax revenues). While tax revenues increase as the economy grows (even without raising tax rates), they have been outpaced by spending over time. This borrowing adds to the national debt which hit the $31.4 trillion debt ceiling in January. Since then, the Treasury Department has been employing what it calls “extraordinary measures” to ensure that the country does not default on its obligations.
The debt ceiling is a mechanism that requires Congress to approve additional borrowing above these levels. Thus, what makes this discussion confusing is that the debt ceiling is not about government spending per se. That spending has already been authorized through the normal budget process that takes place each year.
Thus, the only question around the debt ceiling is whether the government can and should pay its bills. This is akin to signing the papers for a new car and then afterward requesting an increase to your credit limit. For most of us, the decision to buy something can’t be separated from whether we will pay for it, even if it’s with debt. Unfortunately, the Congressional process for approving a budget by September 30 each year is separate from whether the Treasury can actually pay the bills.
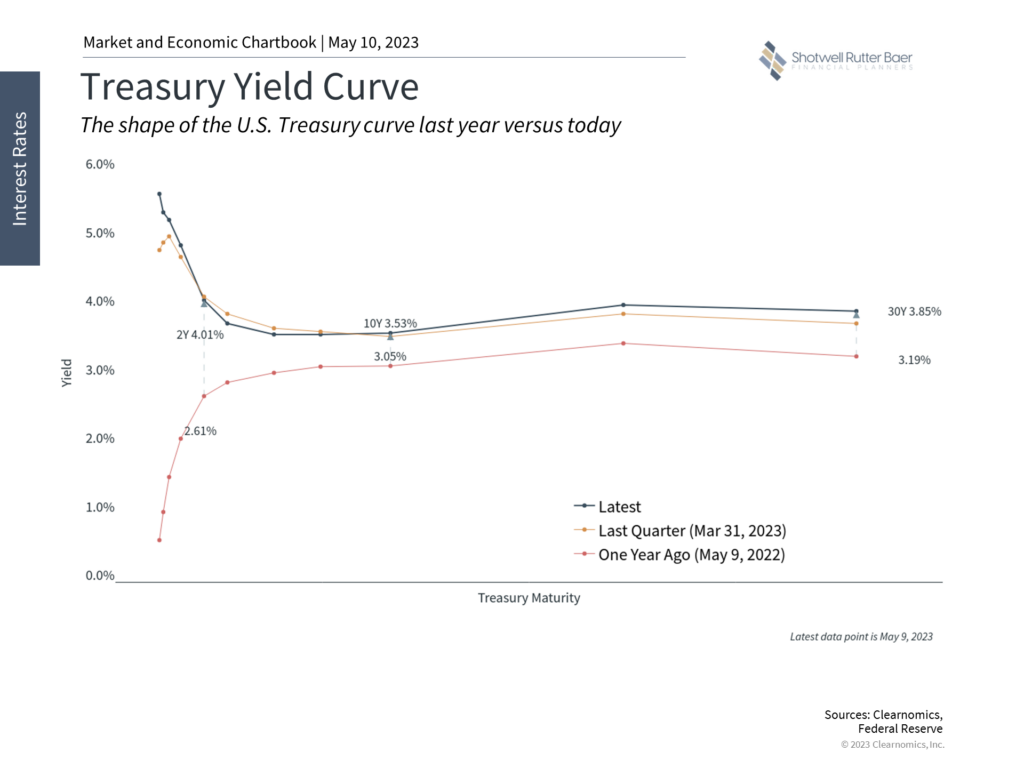
Near-term Treasury rates have jumped but longer-term rates are steady
Second, the large and ever-growing national debt is a controversial topic that impacts the economy and markets in complex ways. At the moment, Democrats, who control the White House and Senate, and Republicans, who control the House of Representatives, are in a standoff. On April 26, the House passed a debt limit bill by a narrow vote margin of 217 to 215. This would increase the debt limit through March 31, 2024, or until the national debt increases by another $1.5 trillion. However, it also includes provisions such as discretionary spending limits, the repeal of renewable energy tax credits, increased work requirements for benefits programs, and others. This makes it politically fraught and thus unlikely to pass the Senate and be signed into law.
As usual, there is plenty of political grandstanding around this issue with each side trying to gain the upper hand. Similar debt ceiling standoffs have occurred over the past decade with the limit suspended and raised in 2013, 2014, 2015, 2017, 2018, 2019, and 2021. According to the Congressional Research Service, the debt ceiling has been raised 102 times since World War II.
Fortunately, despite the headlines and investor concerns, these episodes had little long-term impact on markets. The U.S. has never defaulted on its debt, and nearly all economists and policymakers agree that doing so would lead to turmoil in the financial markets and increase borrowing costs for businesses and everyday citizens. This risk is evident in the bond market with a sharp jump in Treasury rates with maturities around the debt ceiling deadline, and much lower rates thereafter.
The one exception to markets staying relatively calm occurred in 2011 when a similar standoff led Standard & Poor’s, a credit rating agency, to downgrade the U.S. debt. The stock market fell into correction territory with the S&P 500 declining 19%. Ironically, the prices on Treasury securities increased during the 2011 debt ceiling crisis because, even though these were the exact securities being downgraded, investors still believed they were the safest in the world at a time of heightened uncertainty. The debt ceiling was eventually raised and a new budget was approved, allowing markets to bounce back.
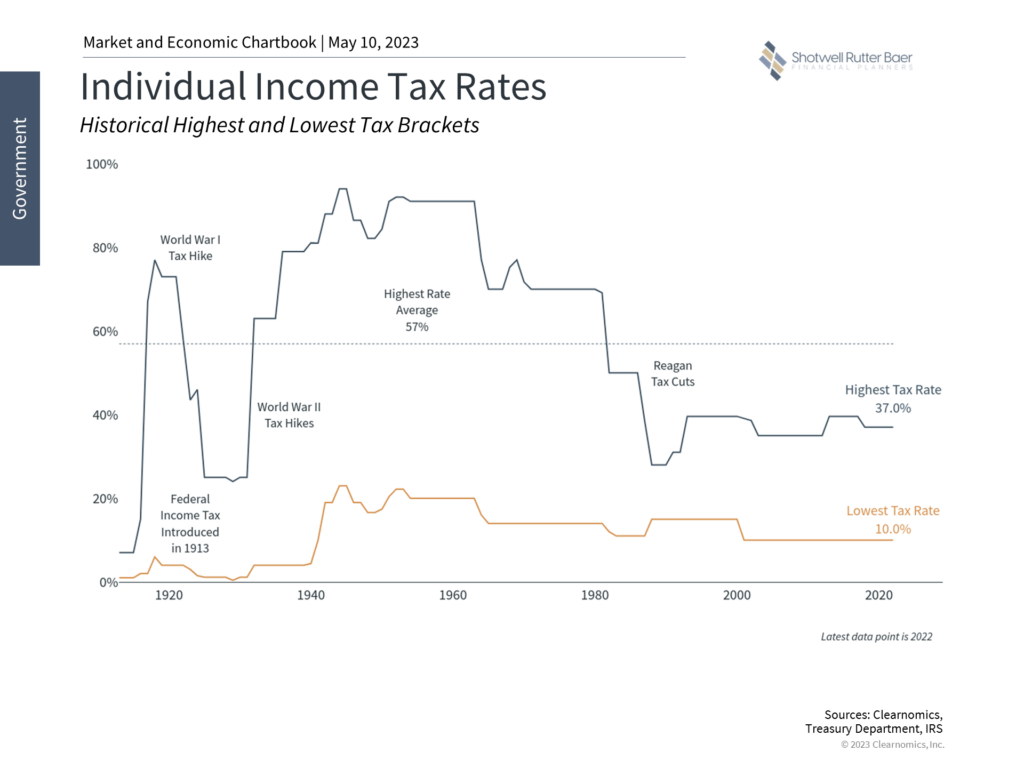
Income tax rates are still low by historical standards
Third, debt ceiling aside, the national debt at today’s level means that it has more than doubled over the past decade and, with very few exceptions, has grown nearly every year over the past century. While everyone generally agrees that the government should not spend more than it generates in tax revenues, the unfortunate reality is that neither party has addressed the problem over the past decade. The last balanced budgets occurred during the Clinton years and the Nixon administration before that.
So, deficits are unlikely to go away. Given how heated the topic of government spending can be, it’s important for investors to distinguish between their political feelings and how they manage their portfolios. In other words, investors should focus on what they can control in order to differentiate how things work from how they would like them to.
One factor beyond the market and economic effects is that the odds of higher tax rates may increase as the national debt worsens. Today, the highest income tax rates are slightly above their lows after the Reagan tax cuts, but still far below historical peaks. High-earners in the mid-1940s paid rates as high as 94% on their marginal incomes. Even those in the lowest bracket would have paid 20% or more during the 1940s, 50s, and 60s – double today’s rates. U.S. corporate tax rates were also among the highest in the world until the 2017 tax cuts. So, while higher tax rates are not guaranteed, engaging in a financial plan that takes advantage of relatively lower rates today can help to protect investors from future tax uncertainty.
The bottom line? The debt ceiling and federal debt need to be resolved in the coming weeks. As with many political issues, it’s important for investors to separate their concerns and not react with their hard-earned savings and investments. History shows that staying invested is the best approach to navigating drama in Washington.
About Shotwell Rutter Baer
Shotwell Rutter Baer is proud to be an independent, fee-only registered investment advisory firm. This means that we are only compensated by our clients for our knowledge and guidance — not from commissions by selling financial products. Our only motivation is to help you achieve financial freedom and peace of mind. By structuring our business this way we believe that many of the conflicts of interest that plague the financial services industry are eliminated. We work for our clients, period.
Click here to learn about the Strategic Reliable Blueprint, our financial plan process for your future.
Call us at 517-321-4832 for financial and retirement investing advice.
Copyright (c) 2023 Clearnomics, Inc. All rights reserved. The information contained herein has been obtained from sources believed to be reliable, but is not necessarily complete and its accuracy cannot be guaranteed. No representation or warranty, express or implied, is made as to the fairness, accuracy, completeness, or correctness of the information and opinions contained herein. The views and the other information provided are subject to change without notice. All reports posted on or via www.clearnomics.com or any affiliated websites, applications, or services are issued without regard to the specific investment objectives, financial situation, or particular needs of any specific recipient and are not to be construed as a solicitation or an offer to buy or sell any securities or related financial instruments. Past performance is not necessarily a guide to future results. Company fundamentals and earnings may be mentioned occasionally, but should not be construed as a recommendation to buy, sell, or hold the company’s stock. Predictions, forecasts, and estimates for any and all markets should not be construed as recommendations to buy, sell, or hold any security–including mutual funds, futures contracts, and exchange traded funds, or any similar instruments. The text, images, and other materials contained or displayed in this report are proprietary to Clearnomics, Inc. and constitute valuable intellectual property. All unauthorized reproduction or other use of material from Clearnomics, Inc. shall be deemed willful infringement(s) of this copyright and other proprietary and intellectual property rights, including but not limited to, rights of privacy. Clearnomics, Inc. expressly reserves all rights in connection with its intellectual property, including without limitation the right to block the transfer of its products and services and/or to track usage thereof, through electronic tracking technology, and all other lawful means, now known or hereafter devised. Clearnomics, Inc. reserves the right, without further notice, to pursue to the fullest extent allowed by the law any and all criminal and civil remedies for the violation of its rights.
Share post:


