In this quarterly market update, we take a step back and look at what really happened during the first quarter of 2026 and what it means for your financial plan.
We have been partnering with East Bay Investment Services since 2021 to help guide our investment models. Each quarter, they provide a balanced view of the economy, including both opportunities and risks. One consistent theme over the years has been the presence of global conflict as part of the overall investment landscape.
In the first quarter of 2026, that risk moved from the background to the forefront. The conflict with Iran pushed oil prices higher and created volatility across both stocks and bonds. Despite that, the bigger story may be how resilient the U.S. economy and markets have been through this period.
Economic growth has continued to move forward, while inflation outside of energy and unemployment has remained relatively stable. While headlines may suggest otherwise, the underlying data tells a more balanced story.
Here is a quick summary of what we saw during the quarter:
- 8% is the average one-year total return for the U.S. stock market following the onset of geopolitical events. Investors who choose to “do something” by selling stock in response to such events tend to miss out on the market’s recovery and future growth.
- 20% represents the amount of the world’s oil supply that passes through the Strait of Hormuz, which is a critical shipping lane that was effectively closed during the war in Iran. Oil prices surged in Q1 as a result, but the price of oil and its long-term effect on stock market returns have not shown a strong causal relationship historically.
- 8 is the number of well-known, large, tech-related companies that underperformed the S&P 500 index in Q1. The collection of stocks is widely known as the “Magnificent 7” and welcomed a new member to the group, now known by some as the “Hateful 8.”
- -1.9% ia the YTD return of a portfolio comprised of 60% MSCI ACWI and 40% Bloomberg Global Aggregate (hedged USD). In other words, despite the unnerving headlines during the year and increased market volatility, a globally balanced portfolio comprised of both stocks and bonds is down just slightly this year.
When we break things down further, we continue to look at the economy through a glass-half-full and glass-half-empty lens.
On the positive side:
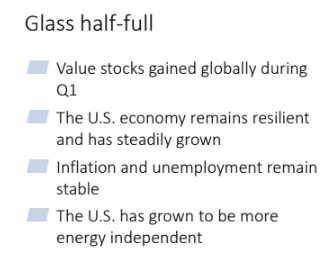
These factors help explain why many portfolios have held up better than expected, even with increased volatility.
On the other side of the equation:
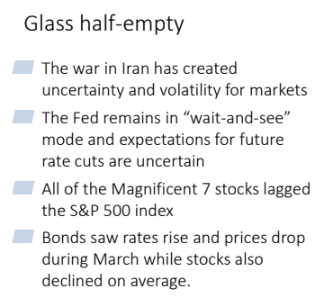
As always, the full picture is more nuanced than any list of bullet points. Markets are influenced by many moving parts, and short-term events often feel more significant than they are over time.
That is why we continue to focus on long-term planning, diversification, and avoiding emotional decisions during periods of uncertainty.
If you would like to take a deeper dive into the data, you can watch the full East Bay quarterly presentation or review the complete report.
Contact SRB today at 517-321-4832 or email us at info@srbadvisors.com. Don’t forget to subscribe to our channel for more bite-sized financial and retirement tips. https://www.youtube.com/@shotwellrutterbaer
Check out the full video here: https://youtu.be/d8rF9KFNr8U
Podcast: Play in new window | Download