What is Monte Carlo Analysis?

We use financial planning software that utilizes a statistical technique called Monte Carlo Analysis. This technique analyzes spending goals from a portfolio over long time periods and calculates the odds of a plan’s success by running the plan with a thousand different potential investment outcomes rather than assuming a portfolio will always achieve its average return.
The analysis is nuanced, and there are some important points to consider in order to understand the results:
- A typical Monte Carlo Analysis uses our plan inputs to look at the portion of a retirement plan’s income that will be provided from a portfolio and runs 1,000 iterations of potential market outcomes for the portfolio to provide a wide range of potential outcomes. It’s as if the market returns for stocks and bonds for the last 100 years were written on cards in an old–fashioned bingo hopper and drawn out one at a time randomly to build a new history.
- The result of a Monte Carlo Analysis is a plan’s success rate. Success in this context means that, for a particular iteration of the plan in

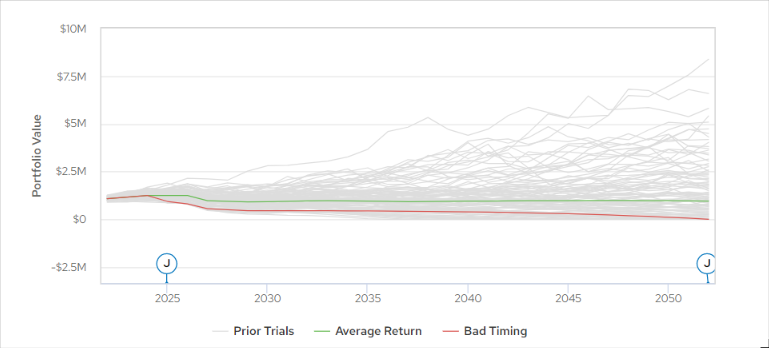
An Example of Monte Carlo Analysis in Money Guide Pro financial planning software. In this example, the plan works 78% of the test iterations, meaning the client had enough money to last through their early 90s.
the analysis, the client made it to the end of the plan (usually sometime in their early 90s) without running out of money. If a plan has a success rate of 80%, that means in 800 of the 1000 combinations of market outcomes they still had money at the end of the plan.
- For most clients, we are NOT trying to make a plan that works out with a success rate of 100%. Rather, our goal is usually to aim for a success rate although this varies a bit based on the age of the client, their outlook, and how much of the plan’s spending would be considered discretionary.
- A plan iteration that fails is also not necessarily a failure. Although a plan with a success rate of 80% has two hundred iterations where the portfolio did not last, the computer assumes that the client does nothing to change their behavior along the way. The unsuccessful iterations of a plan have negative trends spread over a long time that allow for changes in behavior rather than suddenly running out of money unexpectedly.
- The plan’s “comfort zone,” usually between a 75% and 90% success rate, becomes guard rails that tell us year to year if the plan is still on track. If we see the likelihood of success moving down, we know well in advance that we need to address spending and investments with the client.
- When a plan’s success rate is too low, we adjust. It is often surprising to see that a small adjustment to long–term, repetitive goals, makes a significant difference in a plan’s success rate while large changes to one–time spending goals, such as a remodeling project, don’t have much effect. This is due to the impact of inflation, and increased uncertainty because a goal that runs for multiple decades means there is a greater chance for outlier events to hurt the plan. Changing Social Security and pension choices can also have a surprisingly significant impact if the changes result in a higher amount of guaranteed income as that means less reliance on market outcomes to support spending.

The grey lines indicate the range of portfolio outcomes in the analysis. The green line indicates the portfolio with average returns and the red line indicates the portfolio if there was a market crash right at retirement.
- In most cases, a success rate above 90% means that the client could spend more money or save less while working as it will be more likely that their plan will have extra money leftover when they die as a 10% probability that they won’t have enough is statistically small. Clients will differ on this, but the results help put the trade-offs (spending more now or more in retirement versus plan certainty) in context.
- Monte Carlo Analysis is associated with what we call goal-based planning as opposed to cash flow planning. Goal-based planning is good at determining if a plan is acceptable but is not meant to be a good predictor of actual account balances over time. Cash flow planning attempts to account for balances with more precision, but we find there are too many variables involved with planning for a cash flow plan to be accurate except in a very short time frame. As planning industry expert Michael Kitces has stated several times, in planning we’d rather be “vaguely right than precisely wrong.”
Monte Carlo is not a perfect tool. While we find it superior to using historical averages alone, often we use these views in combination to get a feel for how a plan would have worked in different time frames or through specific market events. For instance, we often stress test a plan by using historical results from the financial crisis. We also often show clients how the plan would work if they DID get the historical average return on their investments to help put the Monte Carlo range of outcomes in context.
About Shotwell Rutter Baer
Shotwell Rutter Baer is proud to be an independent, fee-only registered investment advisory firm. This means that we are only compensated by our clients for our knowledge and guidance — not from commissions by selling financial products. Our only motivation is to help you achieve financial freedom and peace of mind. By structuring our business this way we believe that many of the conflicts of interest that plague the financial services industry are eliminated. We work for our clients, period.
Click here to learn about the Strategic Reliable Blueprint, our financial plan process for your future.
Call us at 517-321-4832 for financial and retirement investing advice.
Share post:
